
GIS distribution maps of iron working in the Blackdown Hills
The following reports was written by: Julia Wiecken
This report is going to look at iron working in the Blackdown Hills generally. The Blackdown Hills are an area with a distinctive geology to other areas in southern England. The main importance of this unique geology for the study of iron working is the underlying greensand, containing the iron ore. For a more in depth study of the evidence for iron working throughout the Blackdown hills see the paper by Griffith and Weddel (1996). I am going to concentrate on the distribution patterns visible on the GIS maps (see below) compiled form the data obtained from the Site & Monuments Register (SMR). The distribution maps (see below) are based on all iron working related data present in the SMR. Map 1 shows all the information, which was entered into the GIS database, whereas maps 2 and 3 only show selected types of information. The reasons for the selection process will be outlined below.
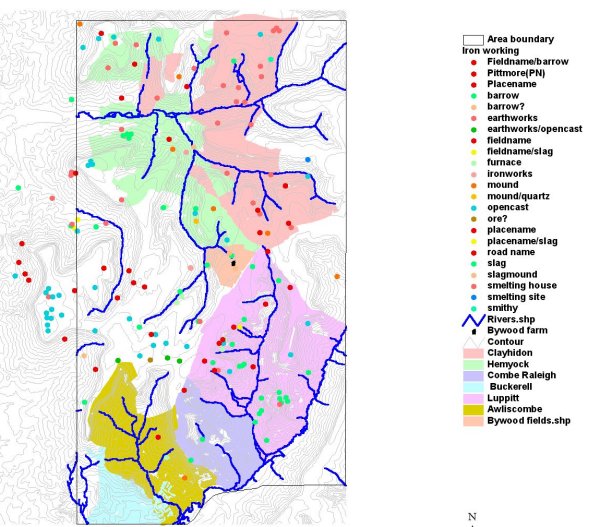
Distribution map 1 shows all possible
iron working related
entries from the Devon Site & Monuments Register (SMR).
Distribution map 1 shows all possible
iron working related
entries from the SMR, which are on the GIS database in question. It shows the parishes of the study
area in different colours (see legend) as well as the streams and rivers. The problem with this
distribution map is that the vast majority of dots are field or place names that do not necessarily
mean that any iron working related activities was carried out at these places. The large number of
different categories mirrors the entries from the SMR and only a visit of every site would enable the
narrowing down of the categories. An entry like “ironworks” does not imply which stages of iron
working are present at the site. Barrows and earthworks are also somewhat dubious links to iron
working. A thorough field visit to all the sites would make it possible to eliminate all sites
without clear evidence for iron working, as well as dividing all other data into clearer categories.
The categories could be based on the different stages of iron production like mining (opencast sites,
ore), smelting (slag mounds and furnace sites) and forging (smithy). The distribution on map 1 is too
random to be able to distinguish any areas or clusters of iron working activity, although the high
number of opencast sites on the higher ground to the west of the study area (Heldon) might be an
exception. Otherwise it is hard to see any patterns at all.
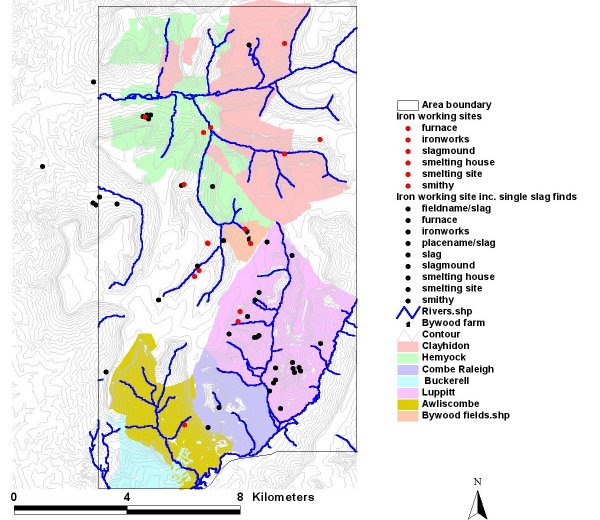
Distribution map 2 shows the more secure categories that indicate iron-working activities
Distribution map 2 shows the more
secure categories that
indicate iron-working activities. Map 2 excludes all place names, barrows and earthworks as well as
opencast sites. This exclusion of certain categories has given the distribution a hopefully truer
patterning concerning the evidence for iron smelting in the Blackown Hills study area. Clear clusters
can be identified which point to areas of intensive iron working. Map 2 still includes all slag
finds; most of them do not have a clear context or any reference to the amount of slag present at
the find spot. This lack of context can of course lead to a bias in the data, as single slag finds
for example do not necessarily imply the presence of iron working. Slag has been extensively re-used
throughout the historic period. It is used in buildings, track ways and other building work (Griffith
and Weddell 1996, p. 30). The heavy recycling of slag means that find spots of slag ought to be
surveyed by a specialist to establish whether the slag is in situ or not.
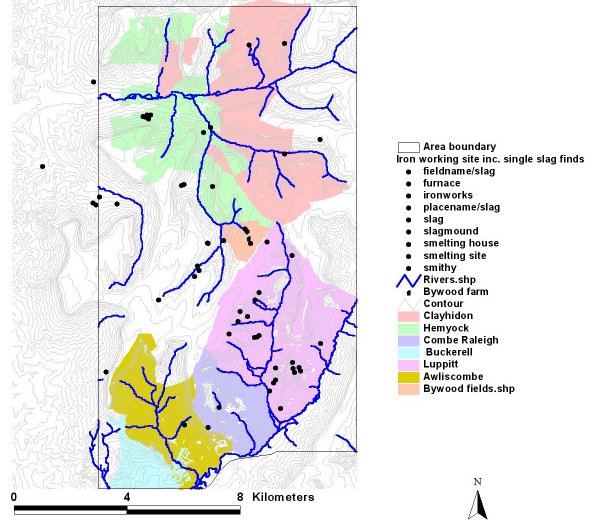
By eliminating single finds of iron-ore slag it is possible to avoid the otherwise heavy bias.
In order to avoid this bias in slag
finds, I have excluded
all slag finds from map 3 in the red category. The exclusion of all slag finds on the other hand
might portray a bias towards too few smelting sites, as a substantial amount of the slag finds might
actually represent smelting sites. Bearing in mind that the red spots on map 3 are the minimum number
of definite smelting and forging sites we can nevertheless see some patterns emerging. The smelting
sites seem to concentrate either along streams and rivers or on hill slopes. In three cases, they
seem to come in pairs; one site situated near the water, and another site about 500m further up the
slope. One of the cases is on Bywood farm (see report on features 3 and 4 above). If this
distribution is significant is impossible to say at this point. It is also generally dangerous to
look at distribution maps for clues of past human behaviour, as the people of the past did not look
at their landscape on maps (Williams 1999, 57). They lived in it and saw the local topography from
the ground. More work needs to be carried out in the field to clarify the categories of the already
known sites, and also to look for more sites, as I am sure there are many still out there.
Another issue the current distribution
maps are not able to
show is the temporal variation of the sites. That is due to the lack of dated sites in the SMR. As
far as I am aware only five sites have been dated by Radiocarbon dating. Four smelting sites have
been dated to the Romano-British period and one to around the 7th and 8th centuries AD (Griffith and
Weddell 1996, p. 33; see report on features 3 and 4 above). The dates so far obtained suggest that
the area of the Blackdown hills was a fairly industrial landscape during the Romano-British period,
which might be the source of the name “Blackdown Hills” (Griffith and Weddell 1996, p. 33).